Hair Care
What Software Opens DLL Files for Free? The Top 7 Options
Jun
Note: DLL files are not ordinary documents. They are Windows library files that can contain code, data, resources, icons, strings, menus, and exported functions used by applications. Open them only for legitimate purposes, such as development, troubleshooting, repair, education, malware analysis in a safe lab, or examining software you are allowed to inspect.
Trying to “open” a DLL file can feel like knocking on a locked door and hearing a robot cough behind it. Double-clicking usually does nothing helpful. Notepad turns it into alphabet soup. Windows may stare back as if you asked it to explain quantum physics before coffee. The reason is simple: a DLL, short for Dynamic Link Library, is built for programs to load, not for humans to read like a PDF.
Still, there are many good reasons to inspect a DLL. Developers may need to view exported functions. IT technicians may need to find missing dependencies. Security analysts may want to check suspicious imports. Power users may want to extract an icon or verify whether a file is a native Windows binary or a .NET assembly. The best free DLL viewer depends on what you want to see: exports, resources, dependencies, metadata, decompiled code, or raw bytes.
This guide covers the top free software options that can open DLL files in a useful way. Some are beginner-friendly. Some are powerful enough to make a debugger blush. None of them magically turn every DLL into perfect source code, because compiled files are not recipe cards. But with the right tool, you can understand a lot more than you would by angrily renaming the file and hoping for a miracle.
Before You Open a DLL File: What Are You Actually Looking For?
The phrase “open DLL file” can mean several different things. A developer might mean, “Show me the exported function names.” A designer might mean, “Can I extract the icon?” A security analyst might mean, “What does this file import, and does it look suspicious?” A .NET developer might mean, “Can I decompile this into readable C#?”
That distinction matters. A native C or C++ DLL is different from a .NET DLL. A resource-only DLL is different from a library packed with compiled machine code. A tool that is excellent for icons may be useless for dependencies. A decompiler that shines with .NET assemblies may look at a native DLL and politely give up, like a cat asked to do taxes.
As a safety rule, do not run random DLL files. Do not download replacement DLLs from unknown “DLL fixer” websites. If your goal is to fix a missing DLL error, reinstall the original program, update Windows, install the correct runtime, or get the file from the official vendor. Opening a DLL for analysis is different from executing or registering it. Curiosity is fine; reckless double-click wizardry is not.
The Top 7 Free Software Options to Open DLL Files
1. Microsoft Visual Studio Community and DUMPBIN
Best for: Developers who want to inspect exports, headers, symbols, and build-related DLL details.
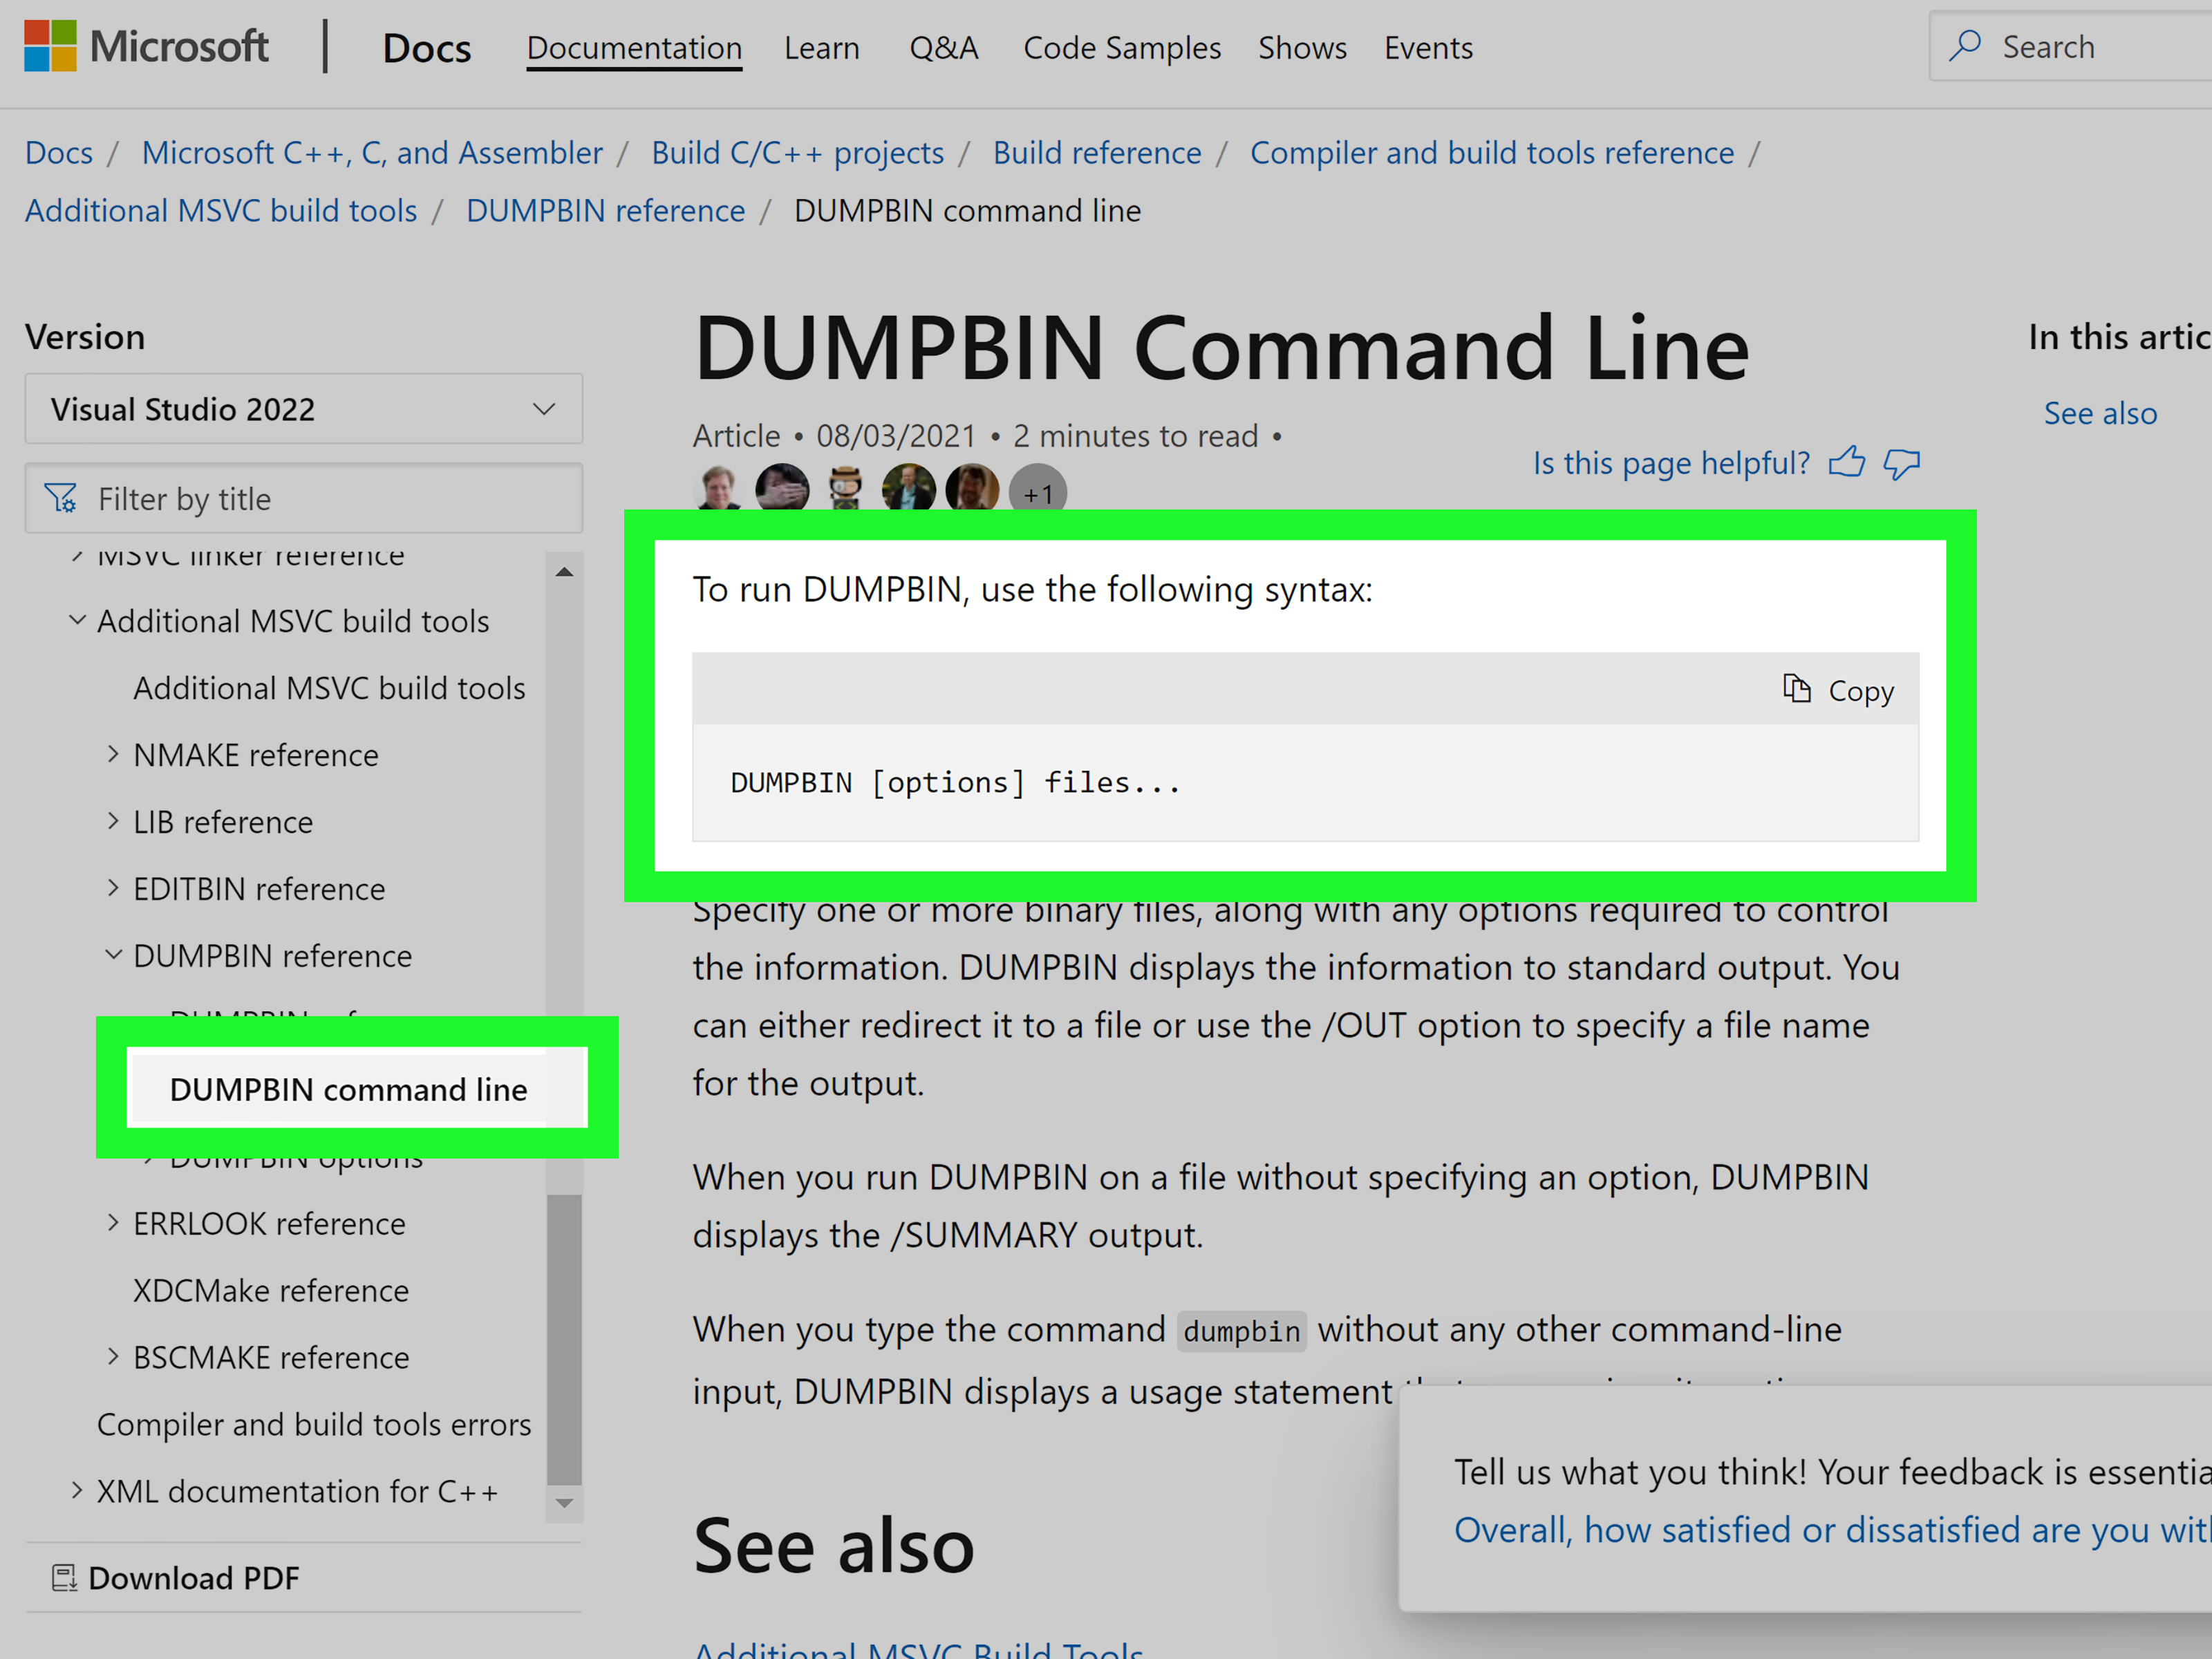
Microsoft Visual Studio Community is one of the most practical free options for developers who need to work with DLL files. It is a full IDE, not just a viewer, and it includes developer tools that can inspect Windows binary files. One of the most useful tools is DUMPBIN, a command-line utility that can examine dynamic-link libraries, executables, object files, and libraries.
For example, if you want to see exported functions in a DLL, you can use:
This is especially useful when you are checking whether a DLL exposes the function your program expects. If an application fails because it cannot find an entry point, export inspection is often the first sensible stop. It is not glamorous, but neither is checking the oil in your car. Both prevent bigger problems.
Visual Studio is also helpful if you are developing your own DLLs. You can create, compile, debug, and test Windows libraries from the same environment. However, Visual Studio is not the easiest option if your only goal is to casually peek inside a file. It is powerful, but it brings the whole toolbox, workbench, garage, and possibly a forklift.
Pros: Official Microsoft tooling, excellent for developers, useful command-line inspection, strong C++ and .NET support.
Cons: Large installation, more complex than a simple viewer, overkill for extracting icons or doing quick dependency checks.
2. Dependencies
Best for: Finding DLL dependencies and troubleshooting missing library errors.
Dependencies is a modern open-source alternative to the classic Dependency Walker. It helps you inspect which DLLs another DLL or EXE relies on. This is extremely useful when a program fails with messages like “missing DLL,” “module not found,” or “the application was unable to start correctly.”
Instead of guessing which runtime or library is missing, you can load the file and inspect its dependency tree. Dependencies can show imported modules, exported functions, and related loading information. For Windows developers and support technicians, this can save hours of “try this installer and pray” troubleshooting.
Dependencies is particularly useful because older dependency tools may struggle with modern Windows API sets and newer system behavior. The interface is more comfortable for current workflows, and the project is widely recognized among developers who still need to solve classic DLL loading problems in modern Windows environments.
Pros: Free, open-source, modern interface, excellent for dependency troubleshooting, useful for both DLL and EXE files.
Cons: Not a full decompiler, not intended for editing DLL contents, requires some understanding of Windows libraries.
3. NirSoft DLL Export Viewer
Best for: Quickly viewing exported functions from DLL files.
NirSoft DLL Export Viewer is a lightweight utility that does one job very well: it displays exported functions from DLL files. If you need to see function names and memory addresses without installing a giant IDE, this tool is refreshingly direct. It is the software equivalent of someone saying, “Here’s the list. No motivational speech.”
This tool is useful for developers, reverse engineers, and advanced users who need quick export information. You can select one or more DLL files and view exported function names, ordinal values, and addresses. That information can help when debugging calls into a library or checking whether a specific API exists inside a module.
It is not designed to decompile code, reveal high-level logic, or explain what every function does. If the function names are stripped, mangled, or vague, the tool cannot magically restore the original developer’s intent. Still, for quick export inspection, it is one of the fastest free choices.
Pros: Small, fast, free, simple, excellent for export lists.
Cons: Limited scope, no deep analysis, no decompilation, not ideal for beginners who do not know what exports are.
4. Resource Hacker
Best for: Viewing, extracting, and editing resources such as icons, dialogs, menus, strings, and version information.
Resource Hacker is a favorite among Windows tinkerers because many DLL files contain resources rather than just code. Those resources may include icons, bitmaps, cursors, menus, dialog layouts, string tables, and version metadata. If you want to open a DLL to inspect or extract these items, Resource Hacker is one of the best free tools available.
For example, a Windows application may store its toolbar icons or dialog text inside a DLL. Resource Hacker can display those resources in a tree view and often lets you save them separately. It can also edit certain resources, although editing should be done carefully. Changing a program DLL without understanding the consequences can break the application faster than you can say, “I definitely backed that up, right?”
Resource Hacker is especially useful for legitimate customization, localization testing, software maintenance, and educational exploration. It is not a general-purpose code decompiler. If a DLL mostly contains compiled native code, Resource Hacker may show limited resources and not much else.
Pros: Excellent for resources, lightweight, supports 32-bit and 64-bit Windows application files, useful GUI, command-line options available.
Cons: Not for deep code analysis, editing can break files, not ideal for dependency troubleshooting.
5. ILSpy
Best for: Opening and decompiling .NET DLL files into readable C#-style code.
ILSpy is one of the best free tools for opening .NET assemblies. If your DLL was built with C#, VB.NET, or another .NET language, ILSpy can often show readable types, methods, namespaces, references, and decompiled code. For developers working with NuGet packages, legacy internal tools, or third-party .NET libraries, ILSpy is incredibly useful.
The important phrase here is “.NET DLL.” ILSpy is not the right tool for every DLL on your system. Native Windows DLLs compiled from C or C++ are a different beast. But for managed .NET assemblies, ILSpy can feel like turning on the lights in a dark room. Suddenly, you can see classes, method names, attributes, and references that make the file much easier to understand.
Common uses include checking how a public method behaves, exploring an unfamiliar library, reviewing dependencies, and recovering insight from old internal assemblies when the original source code has vanished into the corporate fog. Of course, always respect licenses and intellectual property. “The tool can decompile it” is not the same as “you are allowed to reuse it.”
Pros: Free, open-source, excellent .NET decompiler, cross-platform builds available, great for learning and troubleshooting.
Cons: Best for .NET only, decompiled code may not match original source perfectly, not a native-code reverse-engineering suite.
6. dnSpy and dnSpyEx
Best for: Advanced .NET DLL inspection, debugging, and assembly editing.
dnSpy became popular because it combined .NET decompilation with debugging and assembly editing. Although the original dnSpy project is no longer maintained in the same way, dnSpyEx continues the idea for users who still need a powerful .NET assembly browser, debugger, and editor.
If ILSpy is a clean reading room, dnSpy is more like a workshop with tools on the wall and a warning sign that says, “Measure twice.” You can inspect .NET assemblies, browse code, debug without the original source, and in some cases edit assemblies. This makes it useful for developers maintaining older .NET applications, security researchers analyzing managed malware in a lab, and advanced users exploring how assemblies behave at runtime.
Because dnSpy-style tools can edit assemblies, they require extra caution. Always work on copies. Never modify production DLL files directly. Keep backups. Test in an isolated environment. One tiny change in a compiled assembly can cause large and confusing failures, the software version of moving one chair and collapsing the entire dining room.
Pros: Powerful .NET inspection, debugging capabilities, assembly editing, useful for legacy .NET analysis.
Cons: Advanced tool, editing can be risky, not intended for native DLL decompilation, users should verify they are using a maintained and trusted build.
7. Ghidra
Best for: Deep reverse engineering of native DLLs and compiled binaries.
Ghidra is a free, open-source software reverse-engineering framework originally released by the National Security Agency. It supports disassembly, decompilation, graphing, scripting, and analysis across many platforms and architectures. If you need to inspect a native DLL beyond resources and exports, Ghidra is one of the most powerful free options available.
Ghidra is not a “click once and understand everything” tool. Native decompilation is hard. Compiler optimizations, stripped symbols, obfuscation, packed files, and complex control flow can make output difficult to interpret. But for security research, malware analysis, vulnerability research, and advanced software archaeology, Ghidra is a serious tool.
You can import a DLL, let Ghidra analyze it, browse functions, view disassembly, inspect strings, identify imports and exports, and examine decompiled pseudocode. It is especially useful when a DLL is not a .NET assembly and therefore cannot be meaningfully opened in ILSpy or dnSpy.
Pros: Very powerful, free, open-source, supports native binaries, includes decompiler and scripting.
Cons: Steep learning curve, analysis takes time, decompiled output is not original source code, best suited for advanced users.
Quick Comparison: Which Free DLL Tool Should You Use?
| Goal | Best Free Tool | Why It Fits |
|---|---|---|
| View exported functions | DUMPBIN or DLL Export Viewer | Both can show export tables quickly. |
| Find missing dependencies | Dependencies | Designed for troubleshooting DLL load issues. |
| Extract icons or resources | Resource Hacker | Built for viewing and editing Windows resources. |
| Open a .NET DLL | ILSpy | Excellent free .NET assembly browser and decompiler. |
| Debug or edit a .NET assembly | dnSpyEx | Useful for advanced .NET debugging and assembly editing. |
| Analyze native compiled code | Ghidra | Powerful reverse-engineering suite for native binaries. |
| Inspect raw bytes | HxD | A hex editor can open the binary structure directly. |
Helpful Bonus Tools Worth Knowing
PEStudio
PEStudio is excellent when your concern is safety and static analysis. It can inspect Windows portable executable files, including DLLs, without running them. Security analysts use tools like this to review imports, strings, indicators, libraries, sections, and other metadata. If a DLL came from an unknown source, static inspection is much safer than executing it.
Process Explorer
Microsoft Sysinternals Process Explorer does not open a DLL file like a document, but it can show which DLLs a running process has loaded. This is useful when you want to know whether an application is using a specific module, plugin, add-in, or suspicious library.
HxD
HxD is a free hex editor that can open almost any file at the byte level. It is useful when you want to confirm file signatures, search for strings, compare binaries, or inspect raw content. It will not explain the DLL for you, but it will show exactly what is inside.
VirusTotal
VirusTotal can analyze suspicious files with many security engines and reputation signals. It should not be your only decision-maker, because security tools can disagree, but it is useful as one layer of caution when handling unknown DLL files.
Can You Edit DLL Files for Free?
Yes, but the better question is whether you should. Resource Hacker can edit certain resources. dnSpy-style tools can edit some .NET assemblies. Hex editors can modify raw bytes. Ghidra can help understand native code, and advanced workflows may patch binaries. But editing a DLL is risky because programs expect precise structures, function signatures, dependencies, checksums, and behavior.
If you are changing icons or strings in a personal test copy, the risk is manageable. If you are editing a production DLL used by business software, drivers, games, or system components, slow down. Create backups. Work on copies. Document changes. Test in a virtual machine. Never modify Windows system DLLs casually. That path leads to error messages, system instability, and a deep emotional relationship with the phrase “repair install.”
Practical Experiences: What Opening DLL Files Usually Looks Like in Real Life
In real-world troubleshooting, the first lesson is that “open the DLL” is rarely the final goal. Usually, someone is trying to answer a more specific question. Is this DLL missing? Is it the wrong version? Does it export a function? Is it .NET or native? Is it safe? Is it being loaded by the application? The tool you choose depends on that question.
One common experience happens during software deployment. A program runs perfectly on the developer’s machine but crashes on a client computer. The error message complains about a missing DLL, but not always the true missing DLL. In that situation, Dependencies is often the practical hero. You load the EXE or DLL, inspect the dependency tree, and discover that the real issue is a missing Visual C++ runtime, a plugin dependency, or a library sitting in the wrong folder. Suddenly the mystery becomes boring, which is exactly what good troubleshooting should do.
Another common case involves .NET libraries. Suppose a company has an old internal application, but the original source code is incomplete or stored in a forgotten folder named “final-final-real-final-2018.” ILSpy can open the .NET DLL and reveal namespaces, classes, methods, and references. The decompiled output may not be identical to the original source, but it can be good enough to understand behavior, rebuild documentation, or identify which version of a package was used. In this scenario, ILSpy feels less like hacking and more like finding a flashlight in a basement.
Security teams have a different experience. They may receive a suspicious DLL from an endpoint alert, email attachment, or compromised folder. The first move should not be running it. A safer approach is static analysis: check the hash, scan reputation, inspect imports, review strings, and open the file in tools such as PEStudio, Ghidra, or a hex editor inside a controlled lab. Suspicious imports, strange section names, packed content, odd timestamps, or references to network functions can help decide whether deeper analysis is needed. This does not replace professional malware analysis, but it adds structure to the first look.
Designers and modders often meet DLL files through resources. They are not looking for function calls; they want icons, cursors, dialog text, or version strings. Resource Hacker is ideal here. Open the file, browse the resource tree, export what you need, and avoid touching the code. The experience is usually straightforward, unless the application stores assets elsewhere or compresses them in a custom format. Even then, at least you learn whether the DLL is resource-rich or just a quiet brick of compiled logic.
Developers working with native libraries often care about exports. A plugin system might require a function with an exact name. A program might fail because the DLL exports InitializePlugin in one build but not another. DUMPBIN or DLL Export Viewer can answer that in seconds. This is the type of practical inspection that feels small until it saves an entire afternoon. The trick is knowing that you do not need a full reverse-engineering suite for every question. Sometimes the best tool is the simplest one that answers the question without dragging you into binary archaeology.
The final lesson from experience is to treat DLL files with respect. They are small, but they can be powerful. They can support applications, break applications, hide resources, expose APIs, or carry malicious behavior. Free software can open them, inspect them, and sometimes decompile them, but the safest users are the ones who ask a precise question before choosing a tool. A DLL is not a locked diary. It is more like a machine part: useful, technical, and very annoyed when handled with a hammer.
Conclusion
The best free software to open DLL files depends on what “open” means for your task. For exports, use DUMPBIN or NirSoft DLL Export Viewer. For dependency problems, use Dependencies. For resources, use Resource Hacker. For .NET DLLs, start with ILSpy and consider dnSpyEx for advanced debugging or editing. For deep native-code analysis, Ghidra is the strongest free option. For safety checks, add PEStudio, VirusTotal, SmartScreen, and a controlled environment to your workflow.
Most users never need to open DLL files, and modifying them is rarely the right first fix. But for developers, IT troubleshooters, security researchers, and curious power users, the right free DLL viewer can turn a mysterious binary blob into useful information. Just remember: inspect first, run later, and never trust a random DLL download site that looks like it was designed during a thunderstorm in 2006.
